

By The Metric Maven
Bulldog Edition
Sometime in grade school or Junior High I was shown a film called Our Mr. Sun which had been produced in 1956. This science film had a profound effect on my view of the modern industrial world in which we live. The vast majority of the energy available to us originated in the fusion furnace of the sun, and is only stored in various forms on Earth such as wood and grass. The most important concentrated solar energy we use is oil and coal, which might as well be called liquid sunshine, and solid sunshine respectively. Frank C. Baxter (1896-1982) warned that the stored sun energy found in fossil fuels is finite, and that if we do not find alternatives, and our population continues to explode, “then the machine age is over.” The dire warning struck my mind with alarm. It made sense to me that on a finite planet, a finite amount of oil and coal would exist.
Unbeknownst to me, in June of 1956, the same year Our Mr. Sun was released, famed geologist M. King Hubbert delivered a technical paper which predicted how much recoverable oil existed in the United States, and when peak production would occur. Hubbert used the examples of Ohio and Illinois oil production as examples. Production would begin slowly as the oil within a state was located, then increase in an unsustainable exponential manner, and finally decrease. The finite geographical area of the state limited the amount of oil which could be located and extracted. As the reservoirs of oil were depleted, production reached a peak and then declined. This scenario would be true for each of the 50 states, and adding together the entire geographical patchwork would not change the expected extraction curve. Hubbert provided a graph which represented this general trend for all finite exhaustible resources:

The shaded (lined) area under the curve is the total recoverable amount of a resource as it existed before humans began to remove it. The specific subject of Hubbert’s paper concerned the total amount of crude oil which could be recovered by the world, and in particular the United States. Along the way Hubbert offers a graphic of his estimate of “The relative magnitudes of the initial world reserves of all fossil fuels reduced to a common energy unit of measurement.” What is the unit he chooses? It’s kilowatt-hours of heat. A graphic of the total initial energy content for the US is given. Hubbert estimates the total at about 8.5 x 10¹⁵ kW-hr of heat or 30.6 ZJ (Zettajoules).
Hubbert offers a graph of his prediction of world oil production and its peak. His estimate of the ultimate possible production amount for the world is 1250 billion barrels. He states:
“…the curve has been drawn on the assumption that the maximum rate of production will be about two and one-half times the present rate, which places the date of the peak at about the year 2000. As in the case of coal, variations of this assumed maximum rate will advance or retard the date of the culmination.” (pg. 22)
A second graph of US oil production is offered with two scenarios. One where the total amount of recoverable oil is initially 150 billion barrels, and another where it is 200 billion barrels. Hubbert estimates that the US will hit its peak production of oil between 1965 and 1970. The actual year of peak oil in the US was 1971. This was an astonishingly good prediction.


Sometime in the 1970s, I came across a Scientific American book called Energy and Power. I read the article about the predicted world-wide oil production peak, and saw this graph:

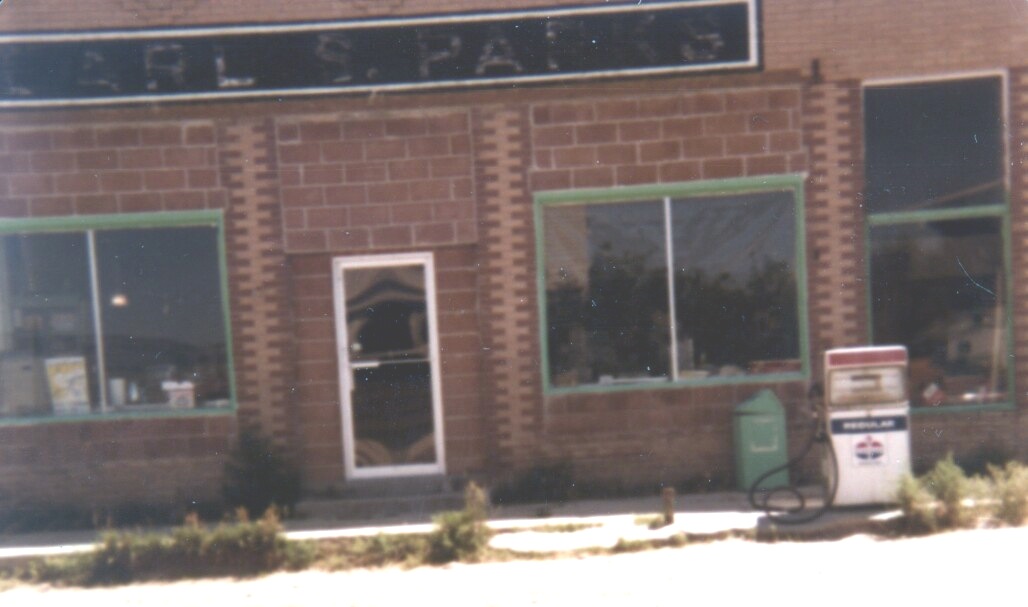
This would be the graph that would burn itself into my memory. It came to mind as the oil embargo of 1973 took hold. In the small Montana town where I lived, we had one single modern gas pump, at the only grocery store in town. Fortunately in a town of about 250 people, I could walk anywhere I needed for most goods and services. I recall asking Harvey (who owned the store) if he had any gasoline for sale. The answer was often “no,” and sometimes “there might just be just enough left to fill your car.” The gasoline pump at Harvey’s store was electric powered, and modern (for 1973) in appearance, but if one looked down the main street, no more than 100 meters, one would see a pair of old visible gas pumps with glass graduated cylinders on top. It had been an old service station, but was now owned by a local resident. One day, when the modern pump was out, he sold me some gasoline from one of the visible gas pumps. A long removable metal rod with a hexagonal end was attached and then pumped back and forth by hand. One could watch as the golden liquid gasoline appeared in the graduated upper glass cylinder. Once the number of gallons had been determined, the hand pumping ended. Gravity would provide the energy needed to deliver the gas through the hose and nozzle into my waiting gas tank. To me, the fact that one could see a pump from the beginning of the oil age, while standing at a pump from the peak of that age in the US was a powerful metaphor for just how ephemeral the oil age could be.
In the mid 1970s, in response to the crisis, the Trans-Alaska Pipeline was constructed to convey oil from the Prudhoe Bay oil fields to Valdez Alaska. It began pumping oil in 1977, but like all oil fields, they also have a production curve which is consistent with Hubbert’s curve. Jonathan Waldman discusses the herculean engineering efforts currently required to keep the pipeline operating in his book: Rust The Longest War. On page 202 he states:
For two decades, the Prudhoe oilfields—Sadlerochit, Northstar, Kuparuk, Endicott, Lisburne—have been declining steadily. Yearly, immutably, they produce 5 percent less oil. The result is that TAPS now carries one quarter of the oil it was designed to carry.
About 340 Megaliters of oil daily exited the pipeline, about 125 Gigaliters annually.

There would be a second oil shock in 1979, but then as life became more distracting, concerns about oil would seem to vanish away. It would be many years before my interest in oil reserves would re-emerge. It is at this point that I will introduce an interlude to ask a fundamental question, about a fundamental resource. Just how much volume is in a barrel? I had not really thought to much about this until I read a seemingly unrelated US Government publication: Weights, Measures, and Conversion Factors for Agricultural Commodities and Their Products. It defines “1 barrel (bbl), liquid = 31-42 gallons” with a footnote. The footnote explains:
“There are a variety of `barrels’ established by law or usage……; by custom, 42 gallons comprise a barrel of crude oil or petroleum products for statistical purposes, and this equivalent is recognized `for liquids’ by four States.”
From the time I first read this footnote, I’ve wondered what the volume of a barrel of oil might be. If one argues that a value is statistical, then its volume fluctuates by definition. The question is how much is the fluctuation? The answer is, it is very hard to know. In the case of oil, often water needs to be injected to drive the oil out. This causes the oil to be “cut” by a given amount. This is broken into fluids and oil. Oil can have different densities which is measured with a specific gravity measurement. The oil is assigned a grade, but not everyone agrees on the grades and methods. I recall Pat Naughtin trying to find out how much oil is in a “barrel of oil” and finally realizing there is no unique definition.
In June of 1982 The Society of Petroleum Engineers issued a new standard which certainly would cause metric philosophers to swoon with its entirely voluntary nature which is stated on the title page. The standard is entitled The SI Metric System of Units and SPE METRIC STANDARD. Here is what it has to say about “the barrel.”
Volume
The liter is an allowable unit for small volumes only. It should be used for volumes not exceeding 100 L. Above this volume (or volume rate) , cubic meters should be used. The only two prefixes allowed with the liter are “milli” and “micro.”
In the U.S., the “-er” ending for meter and liter is official. The official symbol for the liter is “L.” In other countries the symbol may be written as “l” and spelled out with the “-re” ending (metre, litre). Since SPE is international, it is expected that members will use local conventions.
Notice that “API barrel” or simply “barrel” disappears as an allowable volume term.

Well, as a matter of fact, as of forty years later, I have not noticed. Hubbert’s original paper in 1956 used BBL, in 1982 barrel was still in use, and here in 2015, well, we still monkey with barrels. Their declaration that the liter is allowable for small volumes only takes my breath away with its inanity. One can only reduce the size of a liter with milli and micro, but none of that Kilo, Mega, Giga and Tera magnification stuff. The declaration that only real Americans (ok — I’m reading between the lines a bit) use liters and non-Americans—use litres is clearly an important distinction when having a serious discussion about expressing volume. While gasoline might be sold in litres elsewhere, the only unit for volume fit for use, if one must use metric for oil at all, is cubic meters.
Well, Australia was pretty much metric by 1982, I wonder how they handled important topics like liter and litre, and perhaps determining what color one should paint the wheel. In Metrication in Australia (1992) it states:
The Barrel
In the days of rapidly rising oil prices, repeated references were made to production statistics in thousands of barrels per day. All oil was stored and transported in bulk and barrels were never actually used for the purpose. Because of the dominance of the USA in the oil market the barrel seemed destined to continue in international parlance for some time although it was hoped it would eventually be replaced by volumes in cubic metres (m3) or preferably kilolitres (kL) and megalitres (ML). The barrel was a volume equal to 158.987 3 L. It was withdrawn as a Commonwealth legal unit in 1979.
Didn’t the Australians read The Society of Petroleum Engineers assertions that one must never use a magnifying metric prefix with the liter! Then they have the gall to argue that it is preferable to use Kilolitres (KL) and Megalitres! Oh…they used them with litres, not liters, never-mind, I guess the Australians are good according to the voluntary US metric standard for petroleum. They are using “local conventions.” As it is a US voluntary metric standard, I’m going to ignore it like a good American, and use liters with magnifying prefixes in the prose which follow. You have been warned.
Hubbert clearly made an attempt to quantify oil production in his early work, and was able to get rather good results. With all the qualifications previously stated, I will take a shot at some quantification. Clearly it would make sense to specify oil volume in liters. Everywhere but in the US, gasoline is sold in liters, as is oil. I will use current estimates for the total amount of recoverable oil in the world and in the US.
Initial World Volume of Oil 300 TL (Teraliters)
Initial US Volume of Oil 32 TL (Teraliters).
Current World Oil Production is 13.5 GL (Gigaliters) per day. (2013)
US Oil Production 1.35 GL (Gigaliters) per day (2013)
Russian Oil Production 1.73 GL (Gigaliters) per day (2013)
Saudi Arabian Oil Production is 1.57 GL (Gigaliters) per day. (2013)
Current World Oil Consumption 14.7 GL (Gigaliters) per day (2014 est.)
US Oil Consumption is 3 GL (Gigaliters) per day (2014 est.)
What strikes one immediately is the metric prefix used to express the amount of recoverable oil is not that large, and is clearly finite. There is only one metric prefix between the world oil production per day (Giga), and the total amount of recoverable oil (Tera). The current estimates of oil production and consumption appear to be very close to one another. If this is true, one would expect steep increases and decreases in oil price. Kenneth Deffeyes presents data from the natural gas industry to illustrate this situation in a historical context.
Assuming 38.36 MJ (Megajoules) per liter of oil we obtain the total amount of energy which originally existed as 7.67 ZJ (Zettajoules). Now that’s a lot of joules. Recall that the distance across our galaxy is about one Zettameter.
Initial world energy stored in Oil 7.67 ZJ
Initial US energy stored in oil 1.23 ZJ
I had not thought about peak oil for a couple of decades, and then I saw some new books in a local book shop about oil. It was around 2001 that I decided to read Hubbert’s Peak: The Impending World Oil Shortage by Kenneth Deffeyes. I vaguely recalled the prediction that oil would reach its peak production in 2000. Nothing much had seemed to happen thus far, was there any real need for concern?
The thesis of Deffeyes book is very understandable. As one moves downward in the Earth, the temperature increases to a point where oil does not exist. It is so hot that only natural gas of some type will occur. There is clearly no oil in the sky, so from the ground downward there is a limited shell in which oil can exist. We have statistically sampled this shell to the point that we know the probability of encountering oil, and how much to expect. Based on this data we know about how much total oil remains to be found. Indeed it appears the “peak discovery” of oil reserves occurred in 1965.
Deffeye’s book was published at a time when the prediction of the peak had a range from 2000 to 2020 or so. In 2004, the documentary The End of Suburbia was released, and I went to see it. I was curious if there were better peak estimates. There was still a lot of fudging, but the new range appeared to be from 2006-2012 or so. In 2006 Ken Deffeyes claimed that from his computations the peak of worldwide oil consumption took place on December 16, 2005 (2005-12-16).
Independent of whether Deffeyes was correct about the date for peak oil, there were a considerable number of people who did not just argue the peak was further out in time, but deny its existence. In 2007 I renewed my active interest in the metric system. I have continued to watch the oil dispute unfold, but it was only after watching one of Pat Naughtin’s lectures that I realized the average person is innumerate when it comes to oil quantities and production. It also hit me that the metric system was the perfect way to quantify and express oil quantities in such a manner so they could be compared and understood.
In 2013 Donald R. Prothero published Reality Check, which has a chapter on Hubbert’s Peak. His summary is very good, and has a graph with three peaks for silver production in Nevada. The first peak represents the initial bonanza, when silver was found on the surface, the second smaller peak was when upper level low grade ore was processed, and the final, even smaller peak is when tailings were treated with cyanide to extract what little silver remained. The silver extraction was over by 1920, and was never to return. Prothero’s graph is reminiscent of the U.S. oil peak in 1971, which is now being followed by a second “fracking peak.”
Prothero’s graphs do illustrate the situation, but pinball from billions of barrels per year, to millions of barrels per day, to short tons x 10-6 of anthracite coal produced in Pennsylvania (with a reducing scientific notation value that is clearly a typo), to metric tons, then millions of metric tons. Worldwide oil discovery and production is given in Gb/a, which I guess is Gigabarrels annually?—back to billions of barrels of oil per year, with a final million barrels per day of world wide oil production. The public and researchers deserve better.

The current manner in which large quantities are discussed in the media is accomplished using the Ye Olde English modifiers: millions and billions. These descriptions seem to create constant uncertainty, and confusion. If universal metric prefixes are used along with metric units, the values under discussion become much easier to tame, and there is no need for a background in calculus. The initial oil tank of the world was filled with about 300 TL. This prefix should be as recognizable as Kilo, milli or Mega if it was used in popular media, taught effectively in school and implemented by this country overall. To my mind, knowing the estimated total amount of oil available on the planet and its current usage rate is as important as knowing how many people are on the Earth, and the current population growth rate. We started with 300 Teraliters, and that’s it. Humans started removing the oil slowly, but now currently extract about 13.5 Gigaliters per day from what’s left of the original 300 000 Gigaliter pool of oil. This extraction rate, when expressed with the whole number rule, is clearly seen to be significantly depleting what’s left in the ground, and when we run out, we run out.
Postscript
Reader Adrian Sieber wrote to tell me that he has written a blog post entitled Germany—You Have Failed The Metric System, which has his observations concerning the use of the metric system in Germany.
If you liked this essay and wish to support the work of The Metric Maven, please visit his Patreon Page and contribute. Also purchase his books about the metric system:
The first book is titled: Our Crumbling Invisible Infrastructure. It is a succinct set of essays that explain why the absence of the metric system in the US is detrimental to our personal heath and our economy. These essays are separately available for free on my website, but the book has them all in one place in print. The book may be purchased from Amazon here.

The second book is titled The Dimensions of the Cosmos. It takes the metric prefixes from yotta to Yocto and uses each metric prefix to describe a metric world. The book has a considerable number of color images to compliment the prose. It has been receiving good reviews. I think would be a great reference for US science teachers. It has a considerable number of scientific factoids and anecdotes that I believe would be of considerable educational use. It is available from Amazon here.

The third book is called Death By A Thousand Cuts, A Secret History of the Metric System in The United States. This monograph explains how we have been unable to legally deal with weights and measures in the United States from George Washington, to our current day. This book is also available on Amazon here.


